Connecting to MQTT

Once you have set up your first process , you can extend it by adding remote access and monitoring capabilities. A great way how to achieve this is by using the MQTT protocol, which is lightweight and well-suited for this purpose.
To test your MQTT, you can use a free public broker. For example, you can use this one (no registration is required, so you won't need a username or password):
- Broker:
mosquitto.org(MQTT 5) - Broker address:
test.mosquitto.org - TCP Port:
1883 - User:
""(broker requires empty user name for an anonymous user) - Password: n/a
Setting up unicontrol
Setting up unicontrol for an MQTT is a simple process that can be completed entirely within the Wireless page of the web interface. In the MQTT section you only need to configure:
- Connection:
Enabled - Broker address:
test.mosquitto.org(either a domain name or an IP address of the broker can be provided since version 1.07) - User:
"" - Topic Level 1: any unique identifier, for example
johndoe5896 - Topic Level 2: anything you like, for example
home(leaving it empty is also acceptable) - Topic Level 3: anything you like, for example
garagedoor(leaving it empty is also acceptable)
- Subscription - enabled by default
- Port - default value of 1883 is correct
- Password - does not matter when connecting to an anonymous public broker
Click Save to write the changes to memory.
Reconnect every time you save your changes.The device will be trying to connect to the broker permanently, as long as it is allowed and there are no roadblocks such as a missing Wi-Fi connection.
If all the settings were provided correctly, the connection should be established within seconds.
To check if the connection was successful, you may navigate to the System page.
If the MQTT session is alive, the MQTT conn. field will show Yes and MQTT up will track how long the currently active session has lasted.
With the MQTT connection online, the device is ready to exchange messages but is not sending anything process-related yet.
To allow the device to send process-related messages, return to the Processes page of the web interface,
select my_test, and make the following changes:
- Set Input / Publish and Output / Publish to
Allowedto allow sending MQTT messages with the input's state. This will also unhide the following options. - Set Input / Frequency to
10 secondsso that the input state is refreshed by a new message more frequently. - Set Input / Subtopic and Output / Subtopic to
Use nameso that the process's name is embedded into the outbound message Topic for easier identification.
Mobile app set-up
For testing purposes, we can use the IoT MQTT Panel app, which is sufficiently easy to use and has some excellent features for creating and sharing customized dashboards. However, thanks to the MQTT protocols's inherent simplicity, any similar mobile app supporting it can be used with only minor adjustments to the steps outlined below. There is a plenty of them available for android devices (the choice is somewhat limited for iOS, but seems to be slowly catching up):
Once you have installed and opened the app, create a new connection and fill in the following details:
- Connection name: any name you like, for example,
mosquitto - Broker Web/IP address:
test.mosquitto.org - Add Dashboard with any name, for example,
test_ayatec
If the connection details are correct, the app will establish a connection, and you will see an orange tick indicating a success:
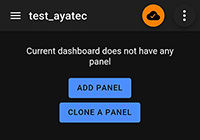
After opening the fresh connection, you will see an empty dashboard with three dots in the upper-right corner. Click on them to show the dashboard menu, and then select Dashboard configurations:
In the Dashboard configurations, you can enter the Dashboard prefix topic as johndoe5896/home/garagedoor/
so that you don't have to include the full topic for each panel separately. Click Save to apply the change:
Receiving telemetry
To create your first panel for monitoring the device's telemetry, return to the empty dashboard and click on the Add Panel icon. From the subsequent selection dialog, choose the LED Indicator option.
Consistently with the previous tutorial and the unicontrol MQTT API (you may check for additional details), in the LED Indicator set-up panel you need to provide:
- Panel name: any name you like, for example,
my_test_in - Topic:
pub/my_test/input(the prefixjohndoe5896/home/garagedoor/will be automatically included) - Payload on:
1 - Payload off:
0
Click Save to add the panel to your dashboard. Your first passive panel my_test_in is now monitoring the D0 input pin
of the my_test process as defined in the previous tutorial:
To create a second panel for monitoring the process output, you can duplicate the first one instead of creating a new one from scratch. To do this, click on the Duplicate icon and select the first panel as the one to duplicate. This will create an identical copy on your dashboard:
Click on the three dots next to the duplicated panel and choose Edit panel to adjust it by changing:
- Panel name:
_into_out - Topic:
/inputto/output
Now you have two panels on your dashboard: one for monitoring the D0 input pin and one for monitoring the D4 output pin (on board LED)
of the my_test process. Both panels will react to changes on their respective pins, with the D0 panel (in) updating every 10 seconds
and the D4 panel (out) updating in real-time.
Sending commands
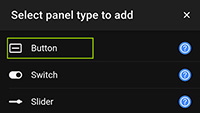
so far the app has only served as a passive data monitor, but you can use it to send commands as well by adding a new Button panel to your dashboard. Click the Add Panel icon and select the Button option.
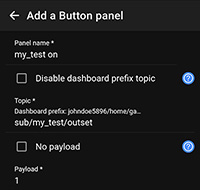
In line with the MQTT API and the set-up presented in the previous tutorial, you need to provide:
- Panel name: any label you like, for example,
my_test on - Topic:
sub/my_test/outset(the prefixjohndoe5896/home/garagedoor/will be automatically included) - Payload:
1
Click Save to add an ON button to your dashboard:
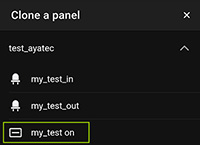
To create an OFF button, duplicate the first one and modify it via Edit panel by changing:
- Panel name:
ontooff - Payload:
1to0
Click Save to add the OFF button to your dashboard.
Now you have both an ON and an OFF button on your dashboard, granting you a direct control over your ESP8266's on-board LED.
Clicking on them alternately will blink the LED and update the my_test_out panel in real-time.
Congratulations! In just a few simple steps, you have created a fully remote control for your ESP8266!
Further reading
Do not forget that the steps in this tutorial were performed using a public broker that is not suitable for real-world applications due to security concerns. To find out more about the topic, including more secure broker options, you may check our selection of useful resources to help you further progress on the quest to your personal, customized IoT application!
- Steve's Internet Guide: an excellent source of information for MQTT beginners
- Instructables.com: step-by-step guide on how to set up an MQTT broker at home using Raspberry PI
- mariushosting.com: set up an MQTT broker easily on your Synology NAS
- arubacloud.com: install and secure your MQTT broker on Ubuntu
- emqx.com: check how simple it is to integrate MQTT messages with Node-RED


